Preserve Surface: See Your Attack Surface Like an Attacker Does
Eliminate blind spots. Own your exposure.
You can't fix what you can't see. Preserve Surface gives you a clear view of your external digital footprint. Discover every domain, subdomain, IP, and technology exposed to the internet before cybercriminals do.
Stop guessing what's online. Start prioritizing what matters and fix vulnerabilities instantly.
Complete Visibility. Actionable Intelligence.
Think you know everything connected to your network? 67% of organizations have unknown assets online. Preserve Surface maps your entire ecosystem in an interactive Hacker View, giving you the same perspective as an attacker. Understand your technology stack, track critical risks, and follow a clear path to remediation, all from a single dashboard.
Visualize Your Attack Surface Hierarchy
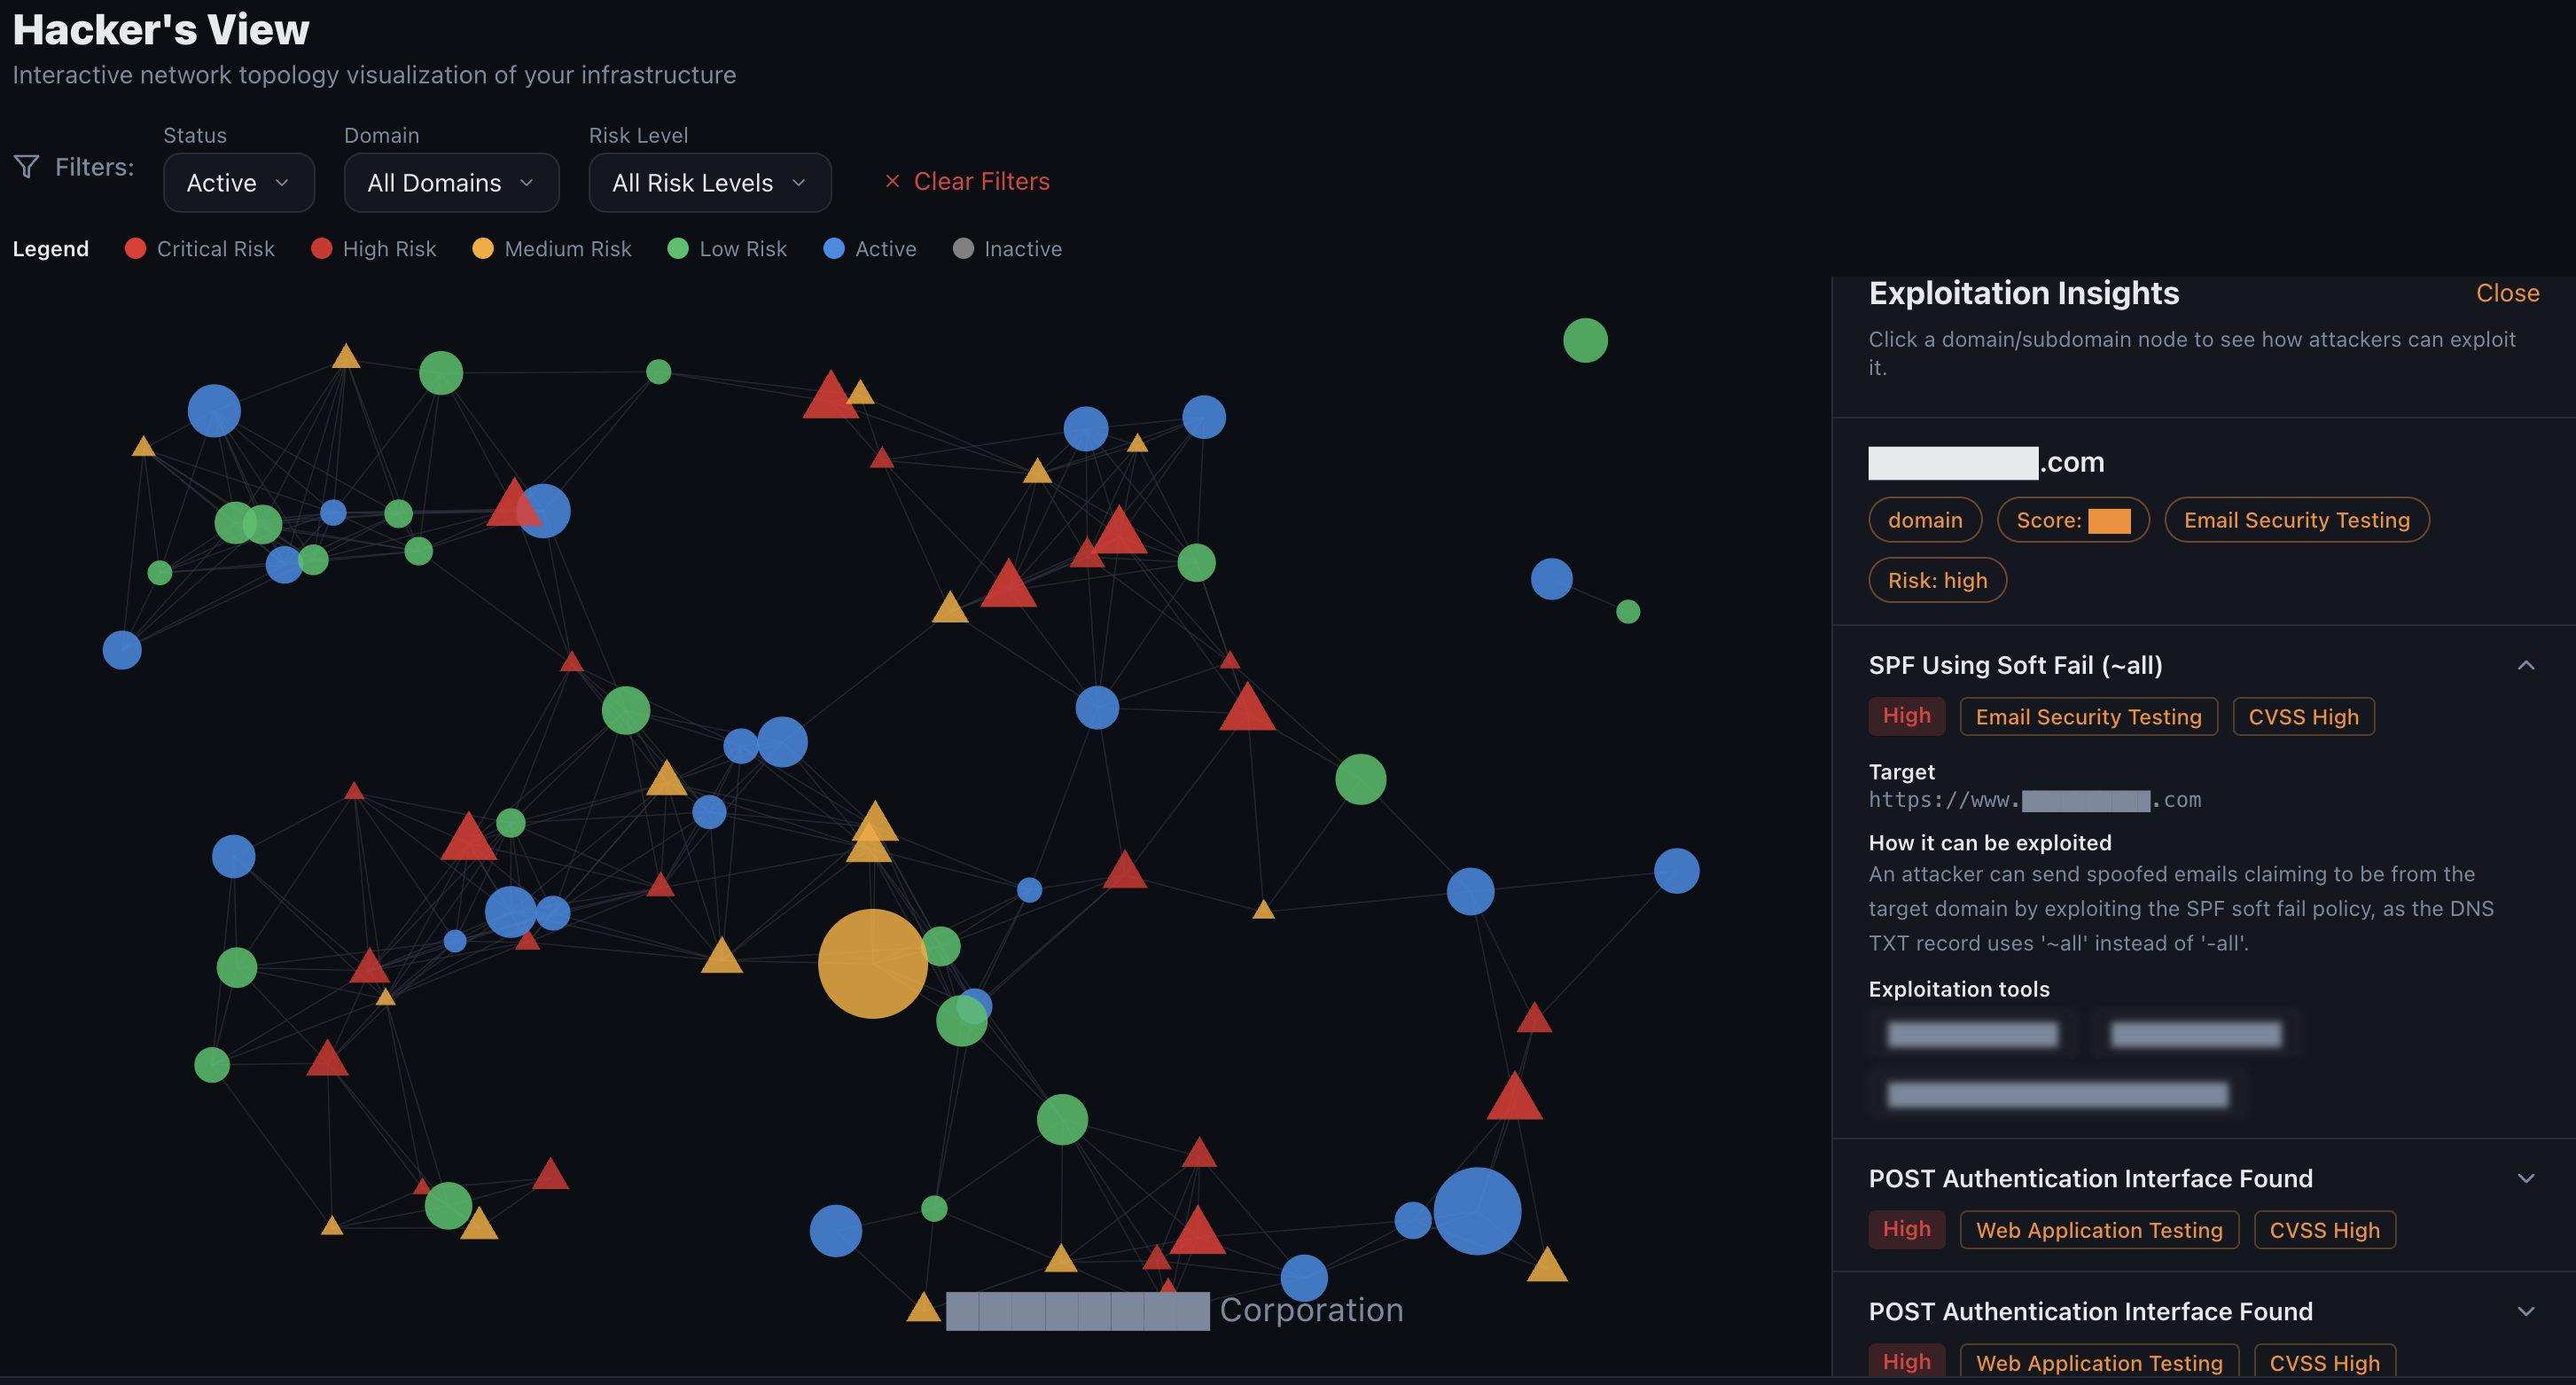
Interactive Hacker View Graph
Watch your digital landscape come to life. Our dynamic graph breaks down your attack surface from Customer to Domains to Subdomains to IPs. Click on any node to dive deeper. It's not just a map, it's your command center.
Powerful Tools to Secure Your Perimeter
Explore the features that turn raw data into a security roadmap.
Risk Summary
Your security at a glance. View your real-time security score, risk distribution, severity breakdowns, and exposure trends.
Learn More →Technology Stack Detection
Know exactly what's running on every asset. Detect CMS, frameworks, libraries, and servers to manage dependencies and legacy risks.
Learn More →Asset Discovery
Automated discovery across domains, subdomains, and IP addresses. Uncover shadow IT and forgotten assets before attackers do.
Learn More →Prioritized Vulnerabilities
Focus on what matters. A clear list filtered by severity and OWASP categories, with specific remediation guidance for your team.
Learn More →Security Roadmap
Stop chasing alerts. Get a strategic, prioritized remediation path with clear milestones to mature your security posture.
Learn More →Assets & Inventory
A single view of all your domains, subdomains, and IPs. Switch between map view, table view, and technology filters whenever you need to dig deeper.
Learn More →Explore the Dashboard in Detail
Risk Summary
Prioritize by Impact
Instantly understand your exposure levels. The Risk Summary distills complex data into a clear security score, severity distribution (Critical, High, Medium, Low), and trend lines so you can report to stakeholders and prioritize remediation effectively.
Vulnerabilities
Actionable Remediation
Move from detection to resolution faster. Filter vulnerabilities by severity, exploit availability, or OWASP Top 10 classification. Each finding comes with context and clear, step by step remediation details.
Assets Management
Total Inventory Control
Gain a unified view of every asset. Whether you prefer a geographical map view or a detailed data table, you can slice and filter by technology to understand exactly what is running where.
Technologies
Dependency Risk Analysis
Create a complete inventory of your technology stack across all assets. Identify outdated software, unsupported technologies, and concentration of risks to streamline patching and modernization.
Don't Let Blind Spots Become Breaches
Your attack surface is constantly changing. Get the visibility you need to stay ahead.
Start your free trial today and map your external footprint in minutes.